[🛠 Tips] Manage header columns on main table view
![Cover Image for [🛠 Tips] Manage header columns on main table view](https://proxyman.imgix.net/assets/blog/custom-header_columns/custom_header_columns.png?auto=format&fit=max&w=3840)
How to manage the default columns?
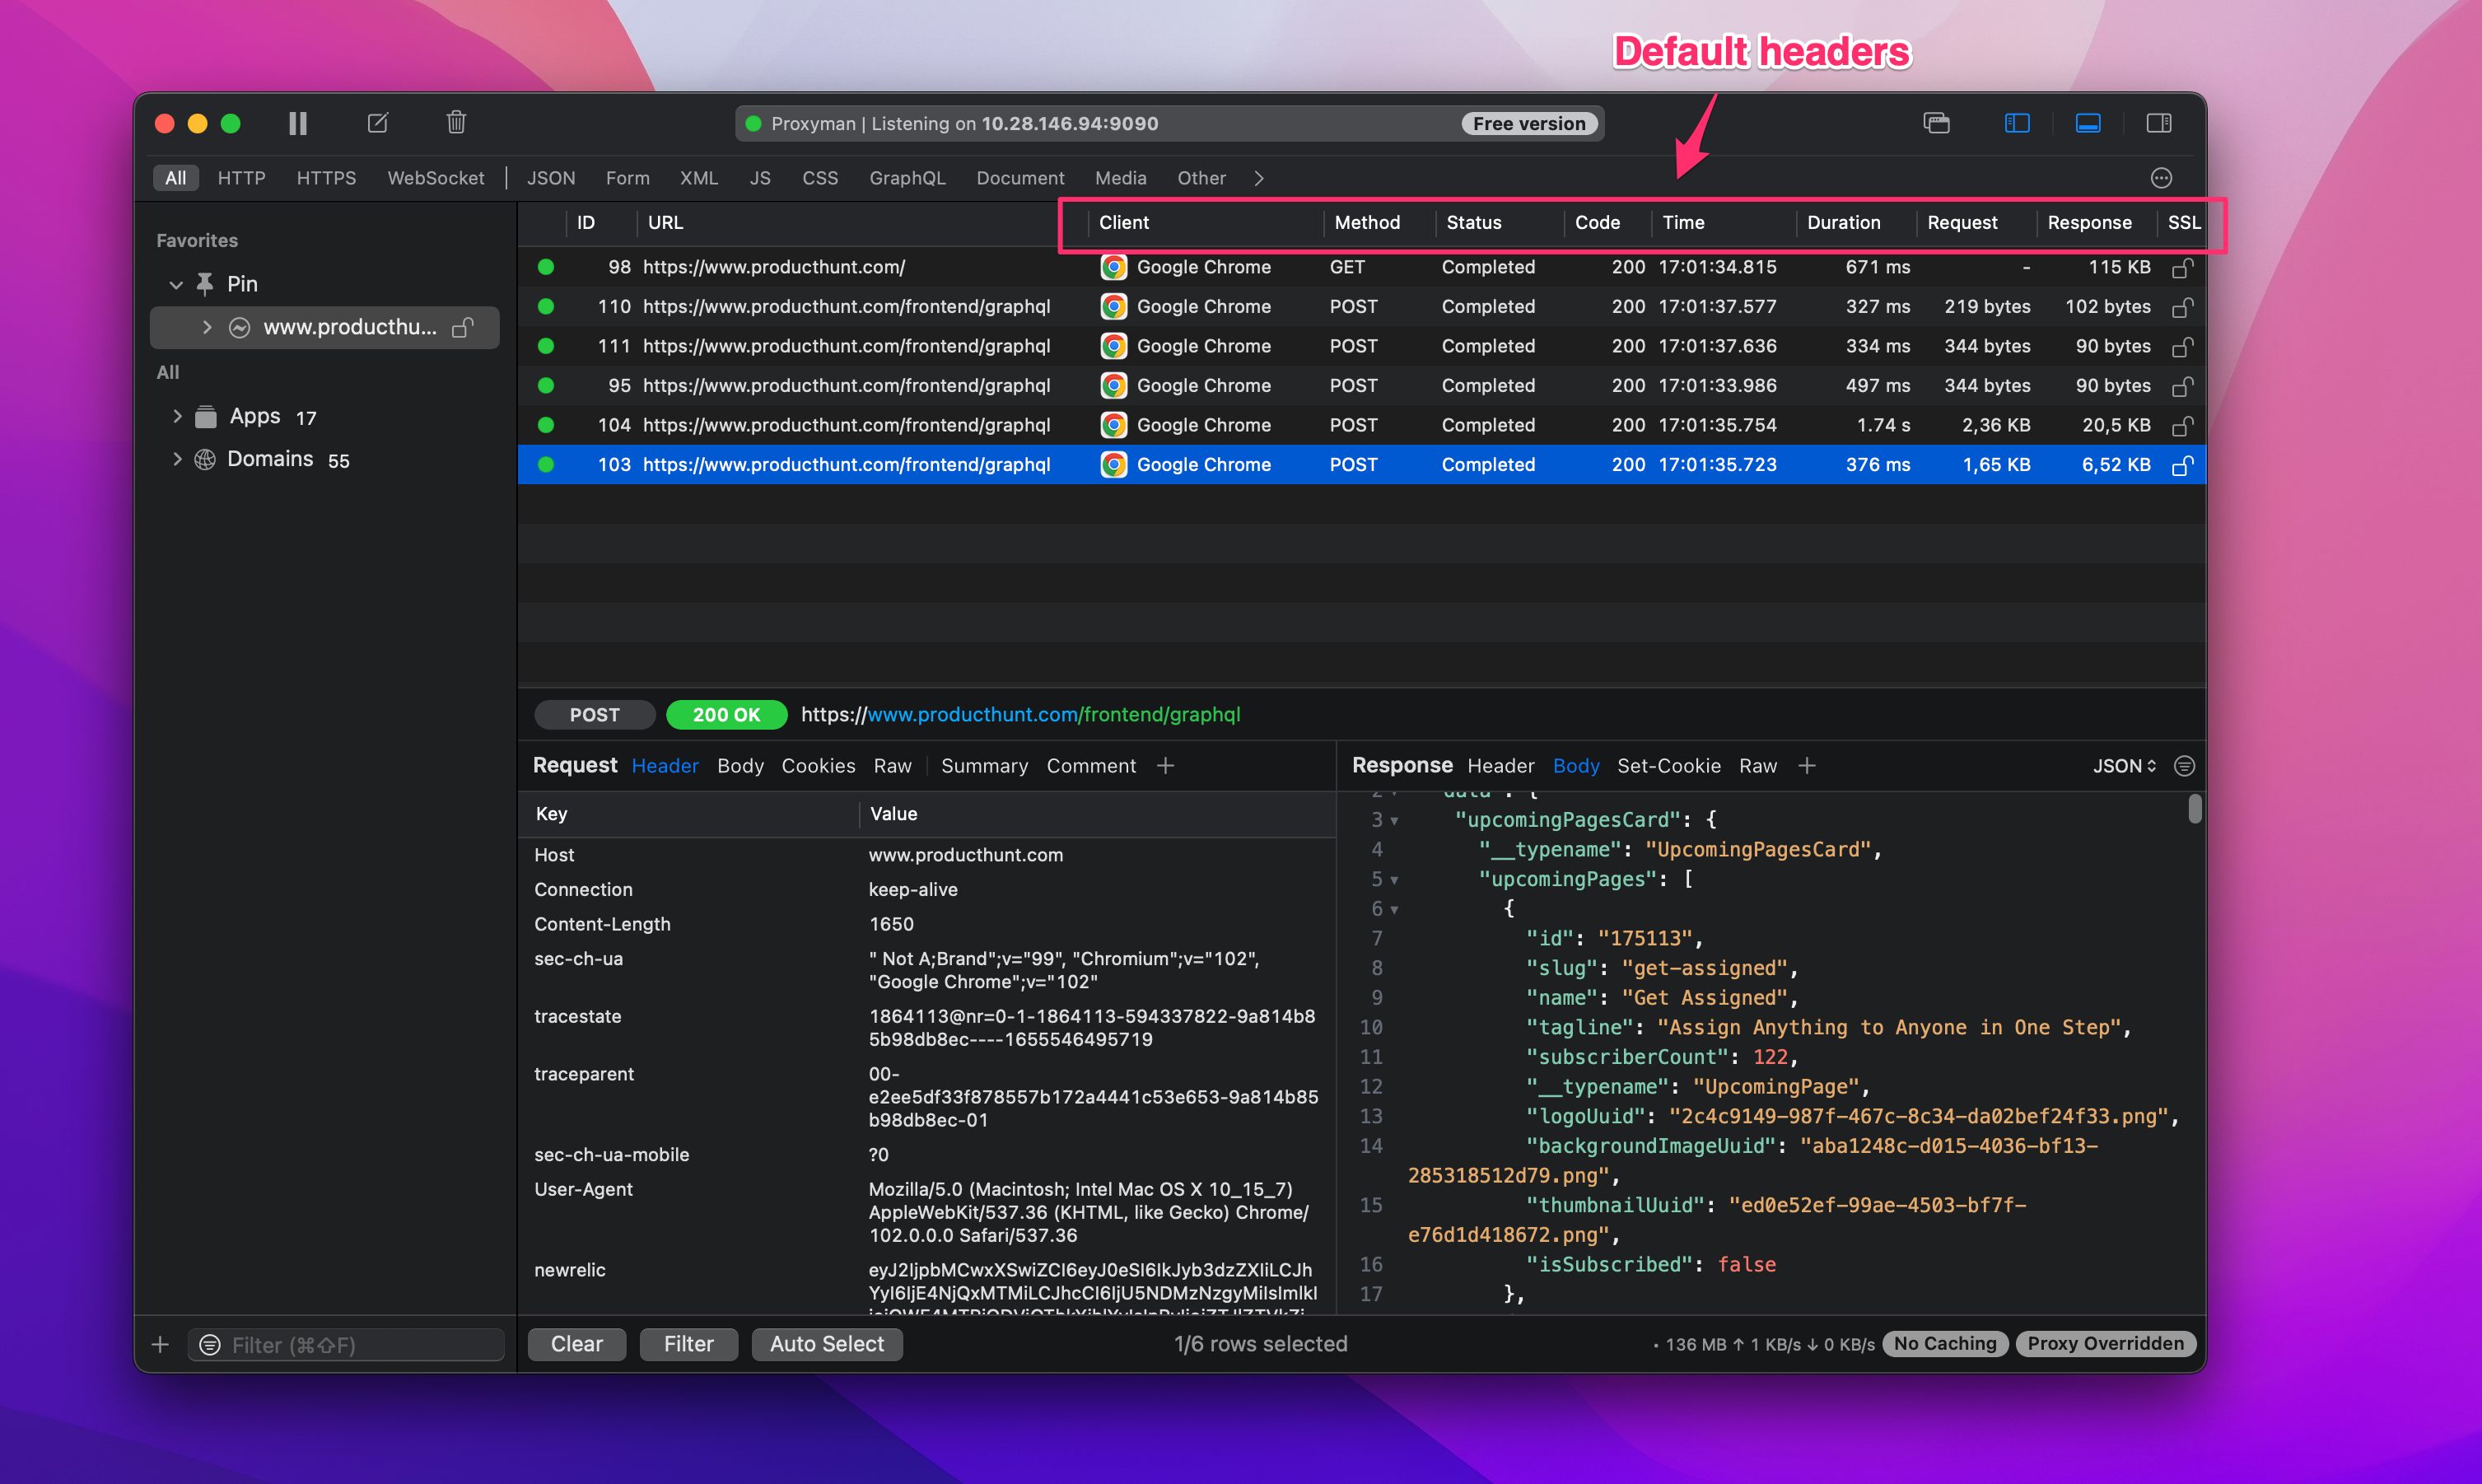 When running, Proxyman will log all requests in the network panel with some default columns: Client, Method, Status, Time, Duration,...
However, you have the option to show/hide these default columns or customize the columns that you want to display on the panel. This helps to increase your productivity:
When running, Proxyman will log all requests in the network panel with some default columns: Client, Method, Status, Time, Duration,...
However, you have the option to show/hide these default columns or customize the columns that you want to display on the panel. This helps to increase your productivity:
- Quickly distinguish each request/response if they have the same URL, but different Headers
- Easily resize/sort/reorder custom columns
- Automatically remember the previous state and restore it for the future session.
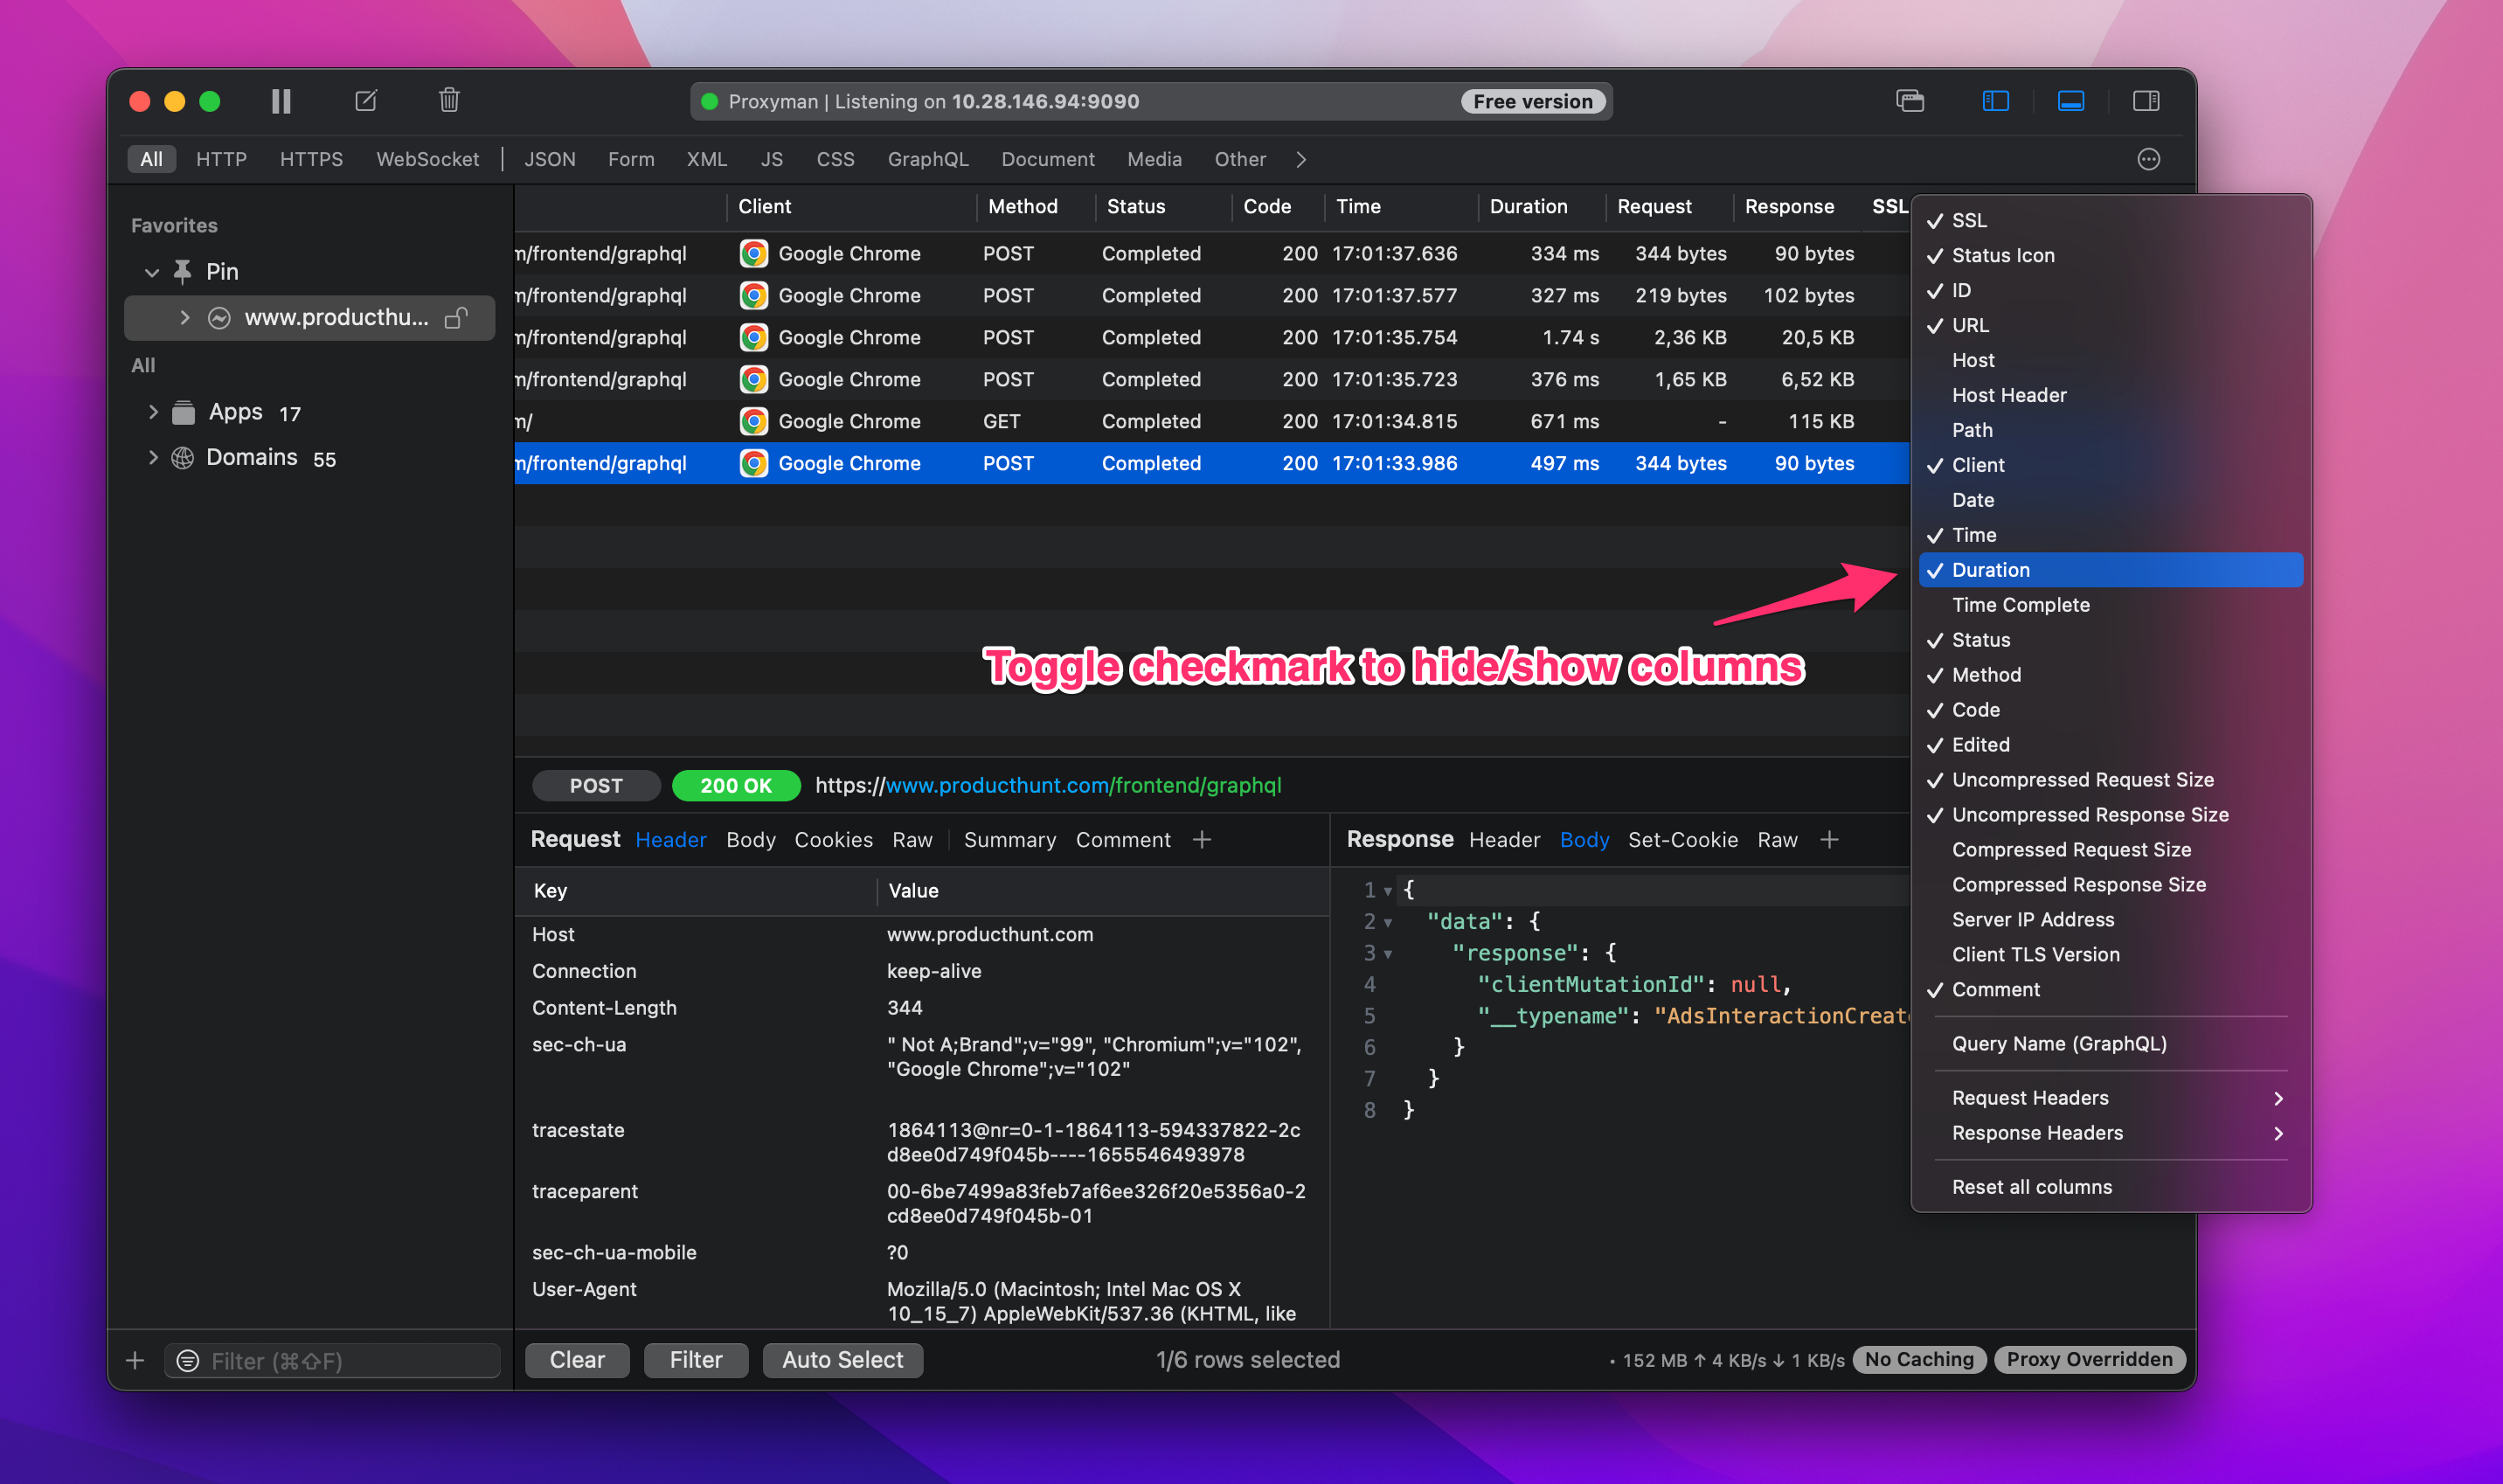
Add or remove columns
Right-click the header of the Requests/Responses table and select an option to hide or show it. Currently displayed options have checkmarks next to them.
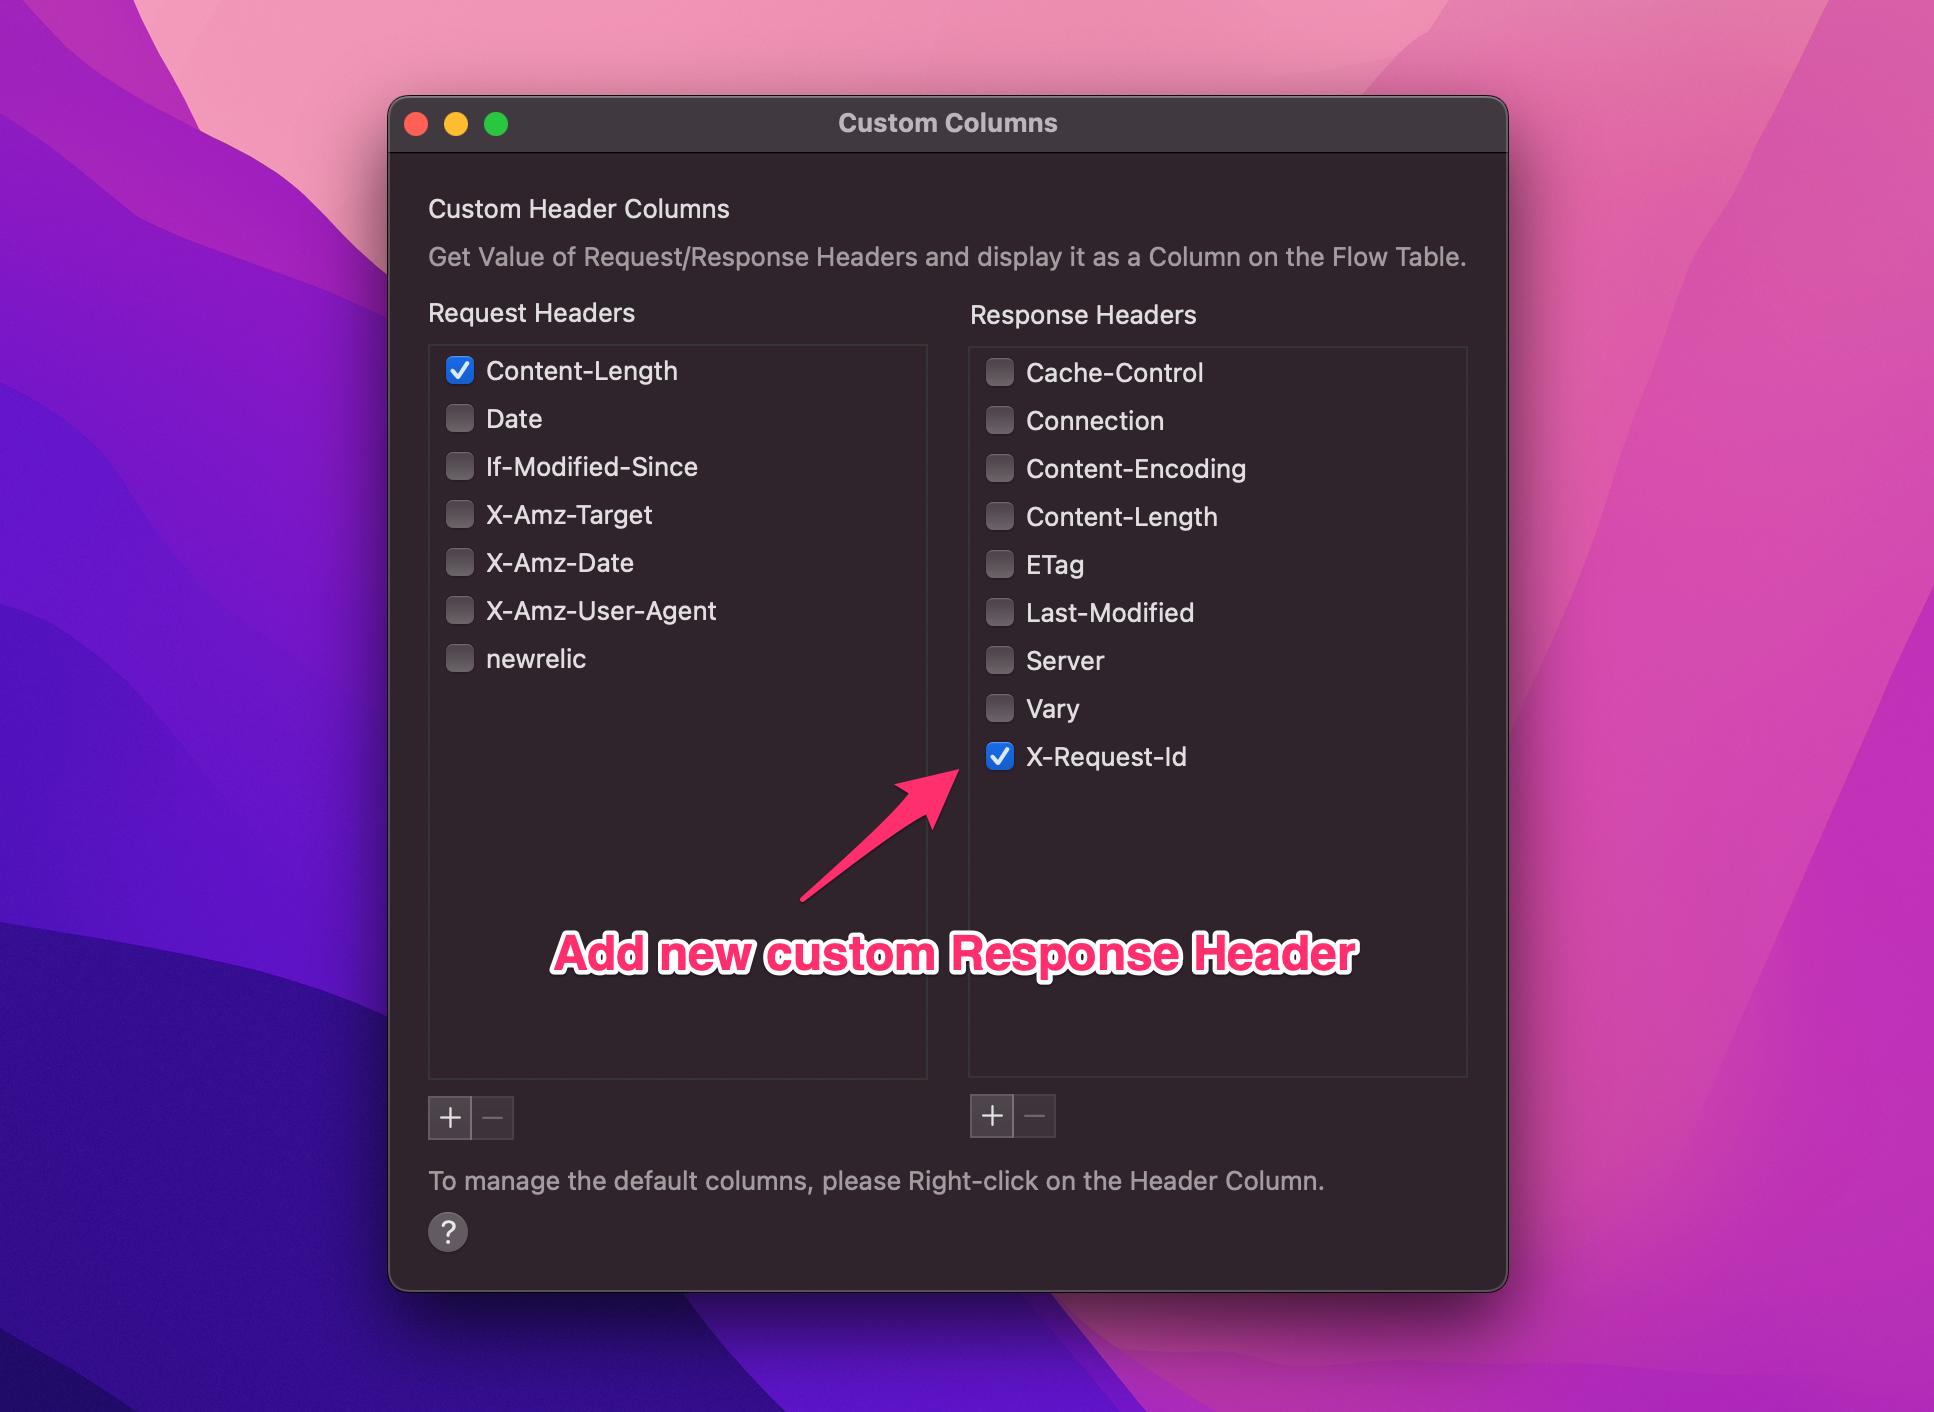
Add custom column
From the Tool Menu -> Select Custom Header Column -> Select as many Headers as you want from the table. You can also right-click the header of the Requests table and select Request/Response Headers > Manage Header Columns to add a custom column to your network panel.
Add query name (GraphQL)
One tips for debugging a GraphQL app is to enable the Query name Header. This way, you can quickly differentiate GraphQL requests based on its query name.

We hope you enjoyed this mini blog about productivity tips with Proxyman. Happy debugging! 👨🏻🚀
Proxyman is a high-performance macOS app, which enables developers to capture and inspect HTTP(s) traffic from apps and domains on iOS devices, iOS Simulators, and Android devices.
Get it at https://proxyman.io/