Useful network debugging tips with Proxyman
This miniblog gives developers helpful tips for using Proxyman to complete some debugging tasks faster and more efficiently.
1. Filter URLs
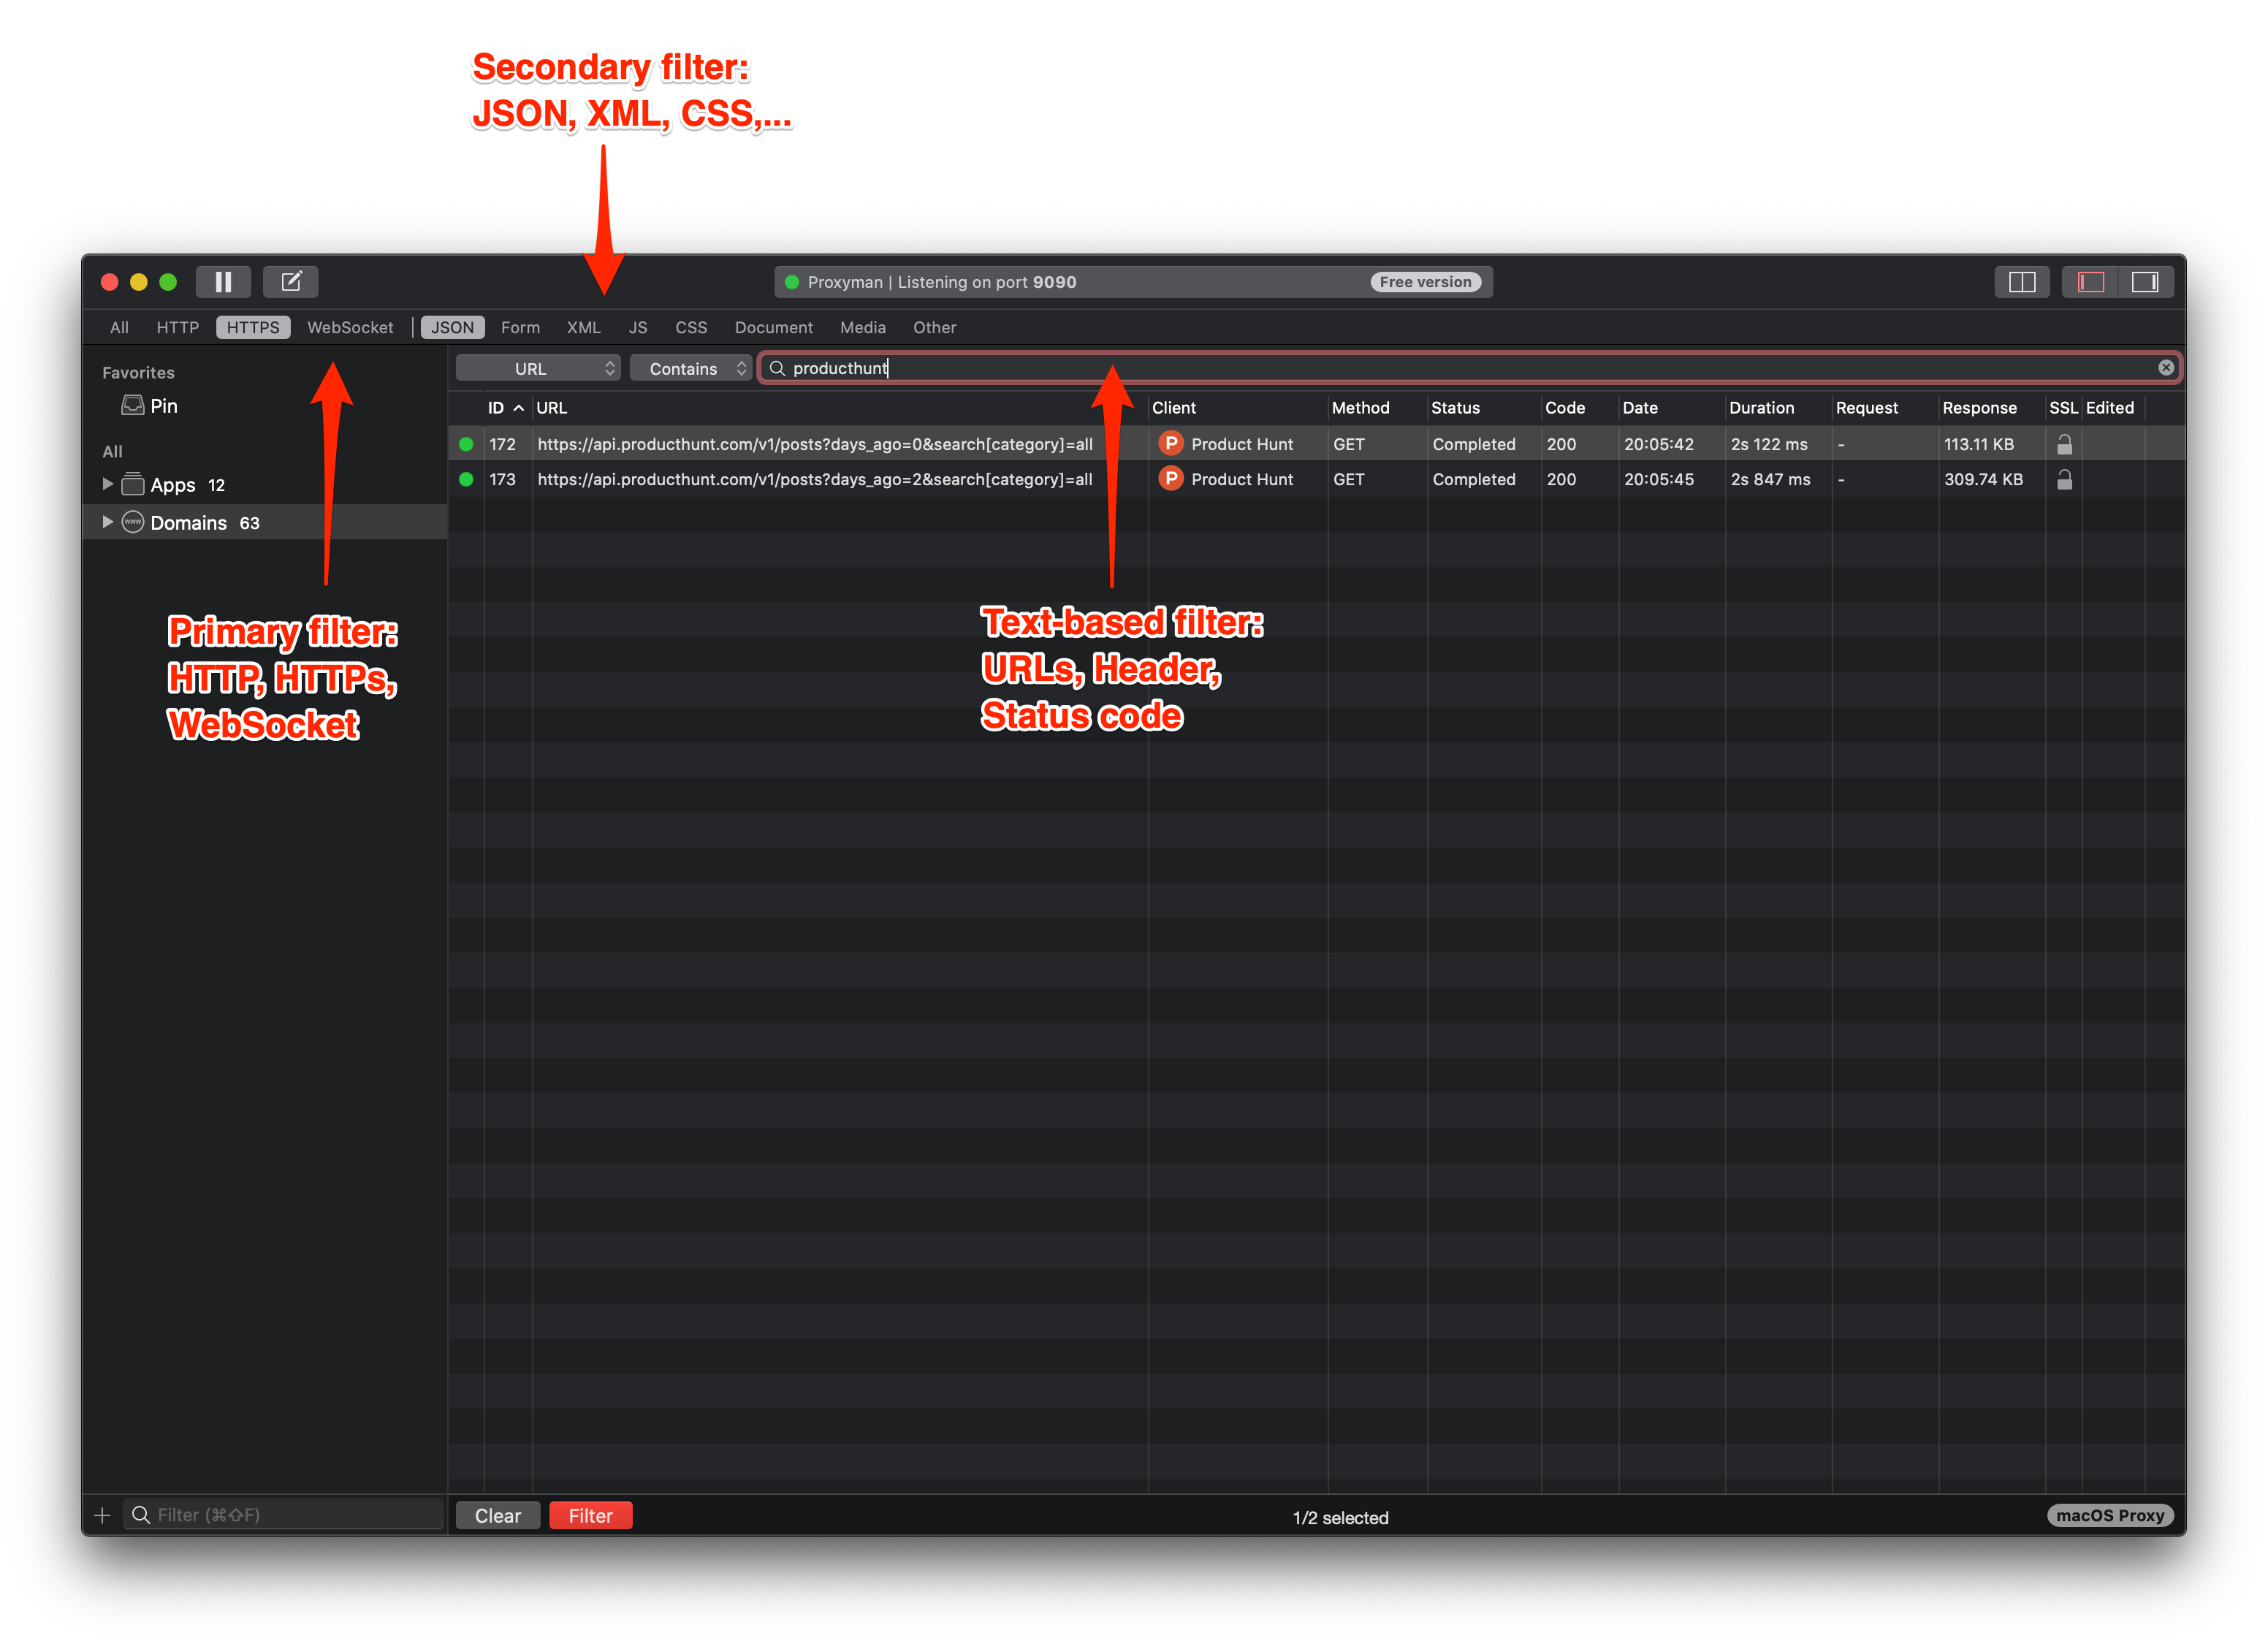
Since Proxyman 1.8.0, developers are now able to switch/combine different layers of Filtering to narrow down their search
- Primary filter: Quickly filter URLs by HTTP/ HTTPs or Web Socket
- Secondary filter: Add one more layer by selecting JSON, XML, CSS,..
- Text-based filter: Use Command + F for other text-based search like specific URL(s), Header, Status Code,…
2. Pin URLs
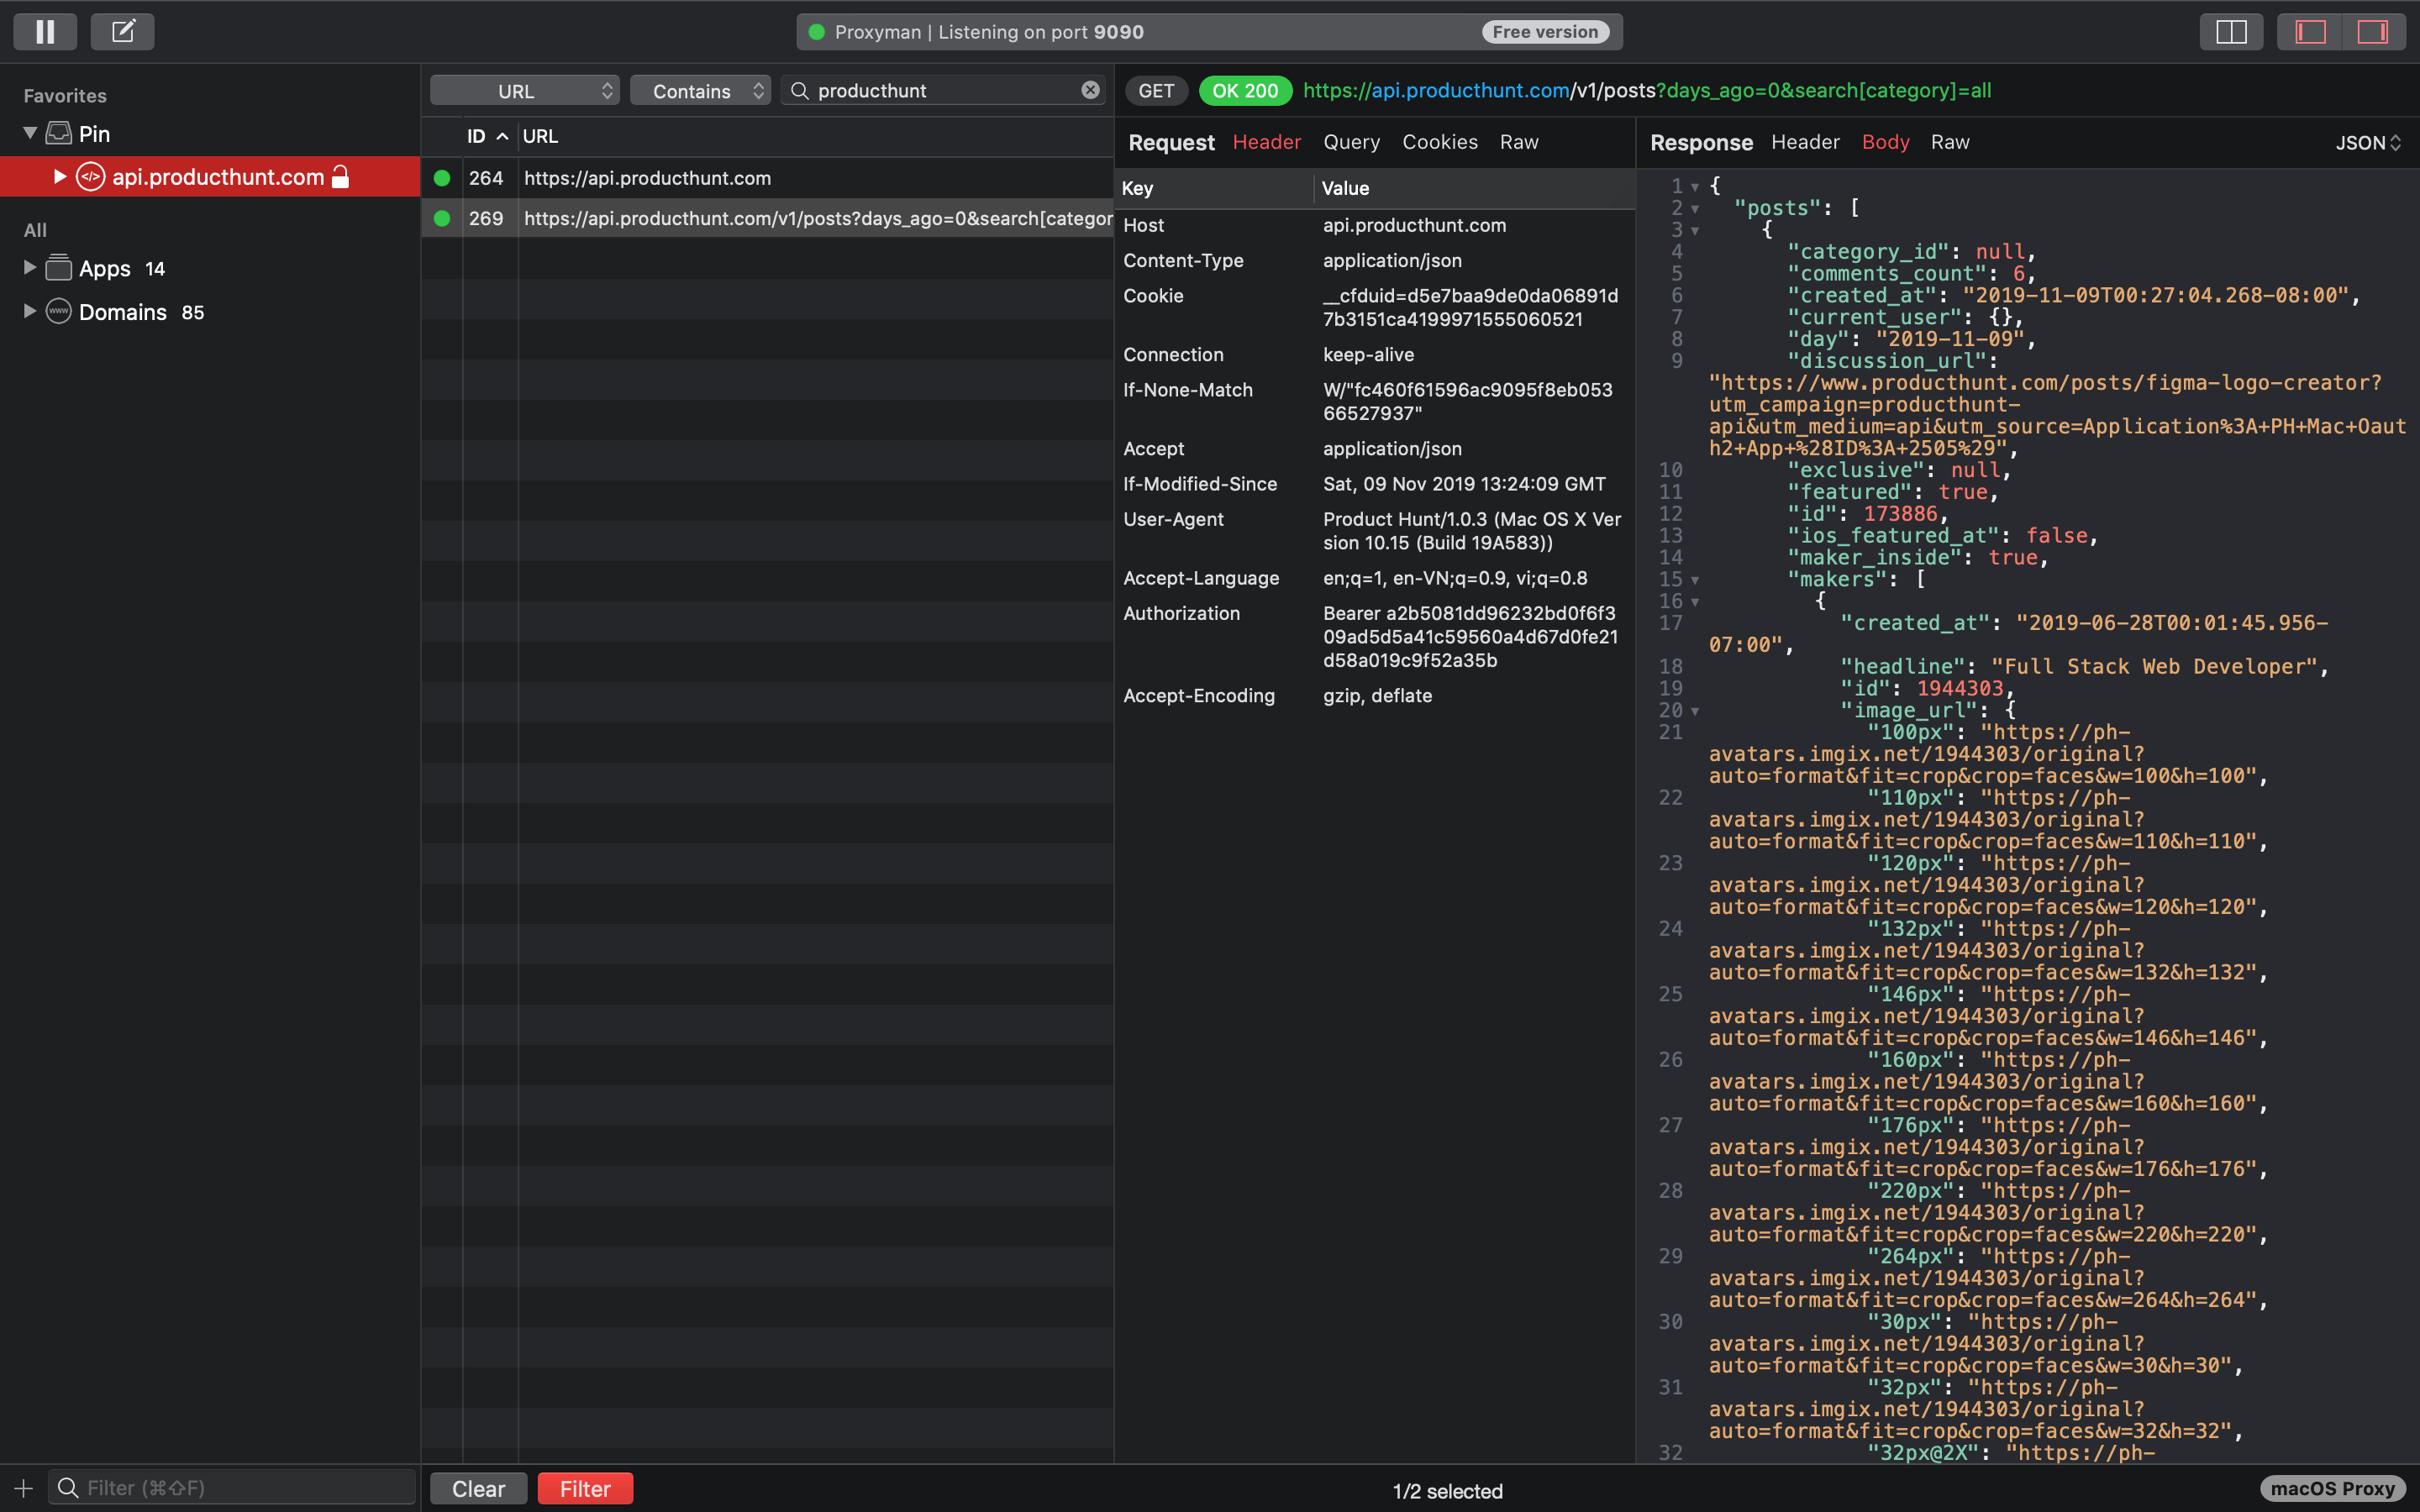
When the first time developers select an URL, it’s still encrypted so you are not able to see the content of that request.
However, if you right click → select Pin to Favorites, not only the request is isolated but also Proxyman would automatically enable SSL Proxying for you.
With that one-click, the content should show up as soon as you re-send the quest.
Another way is using Drag/Drop to Pin an URL (it works almost similarly)
3. Open Content in new window
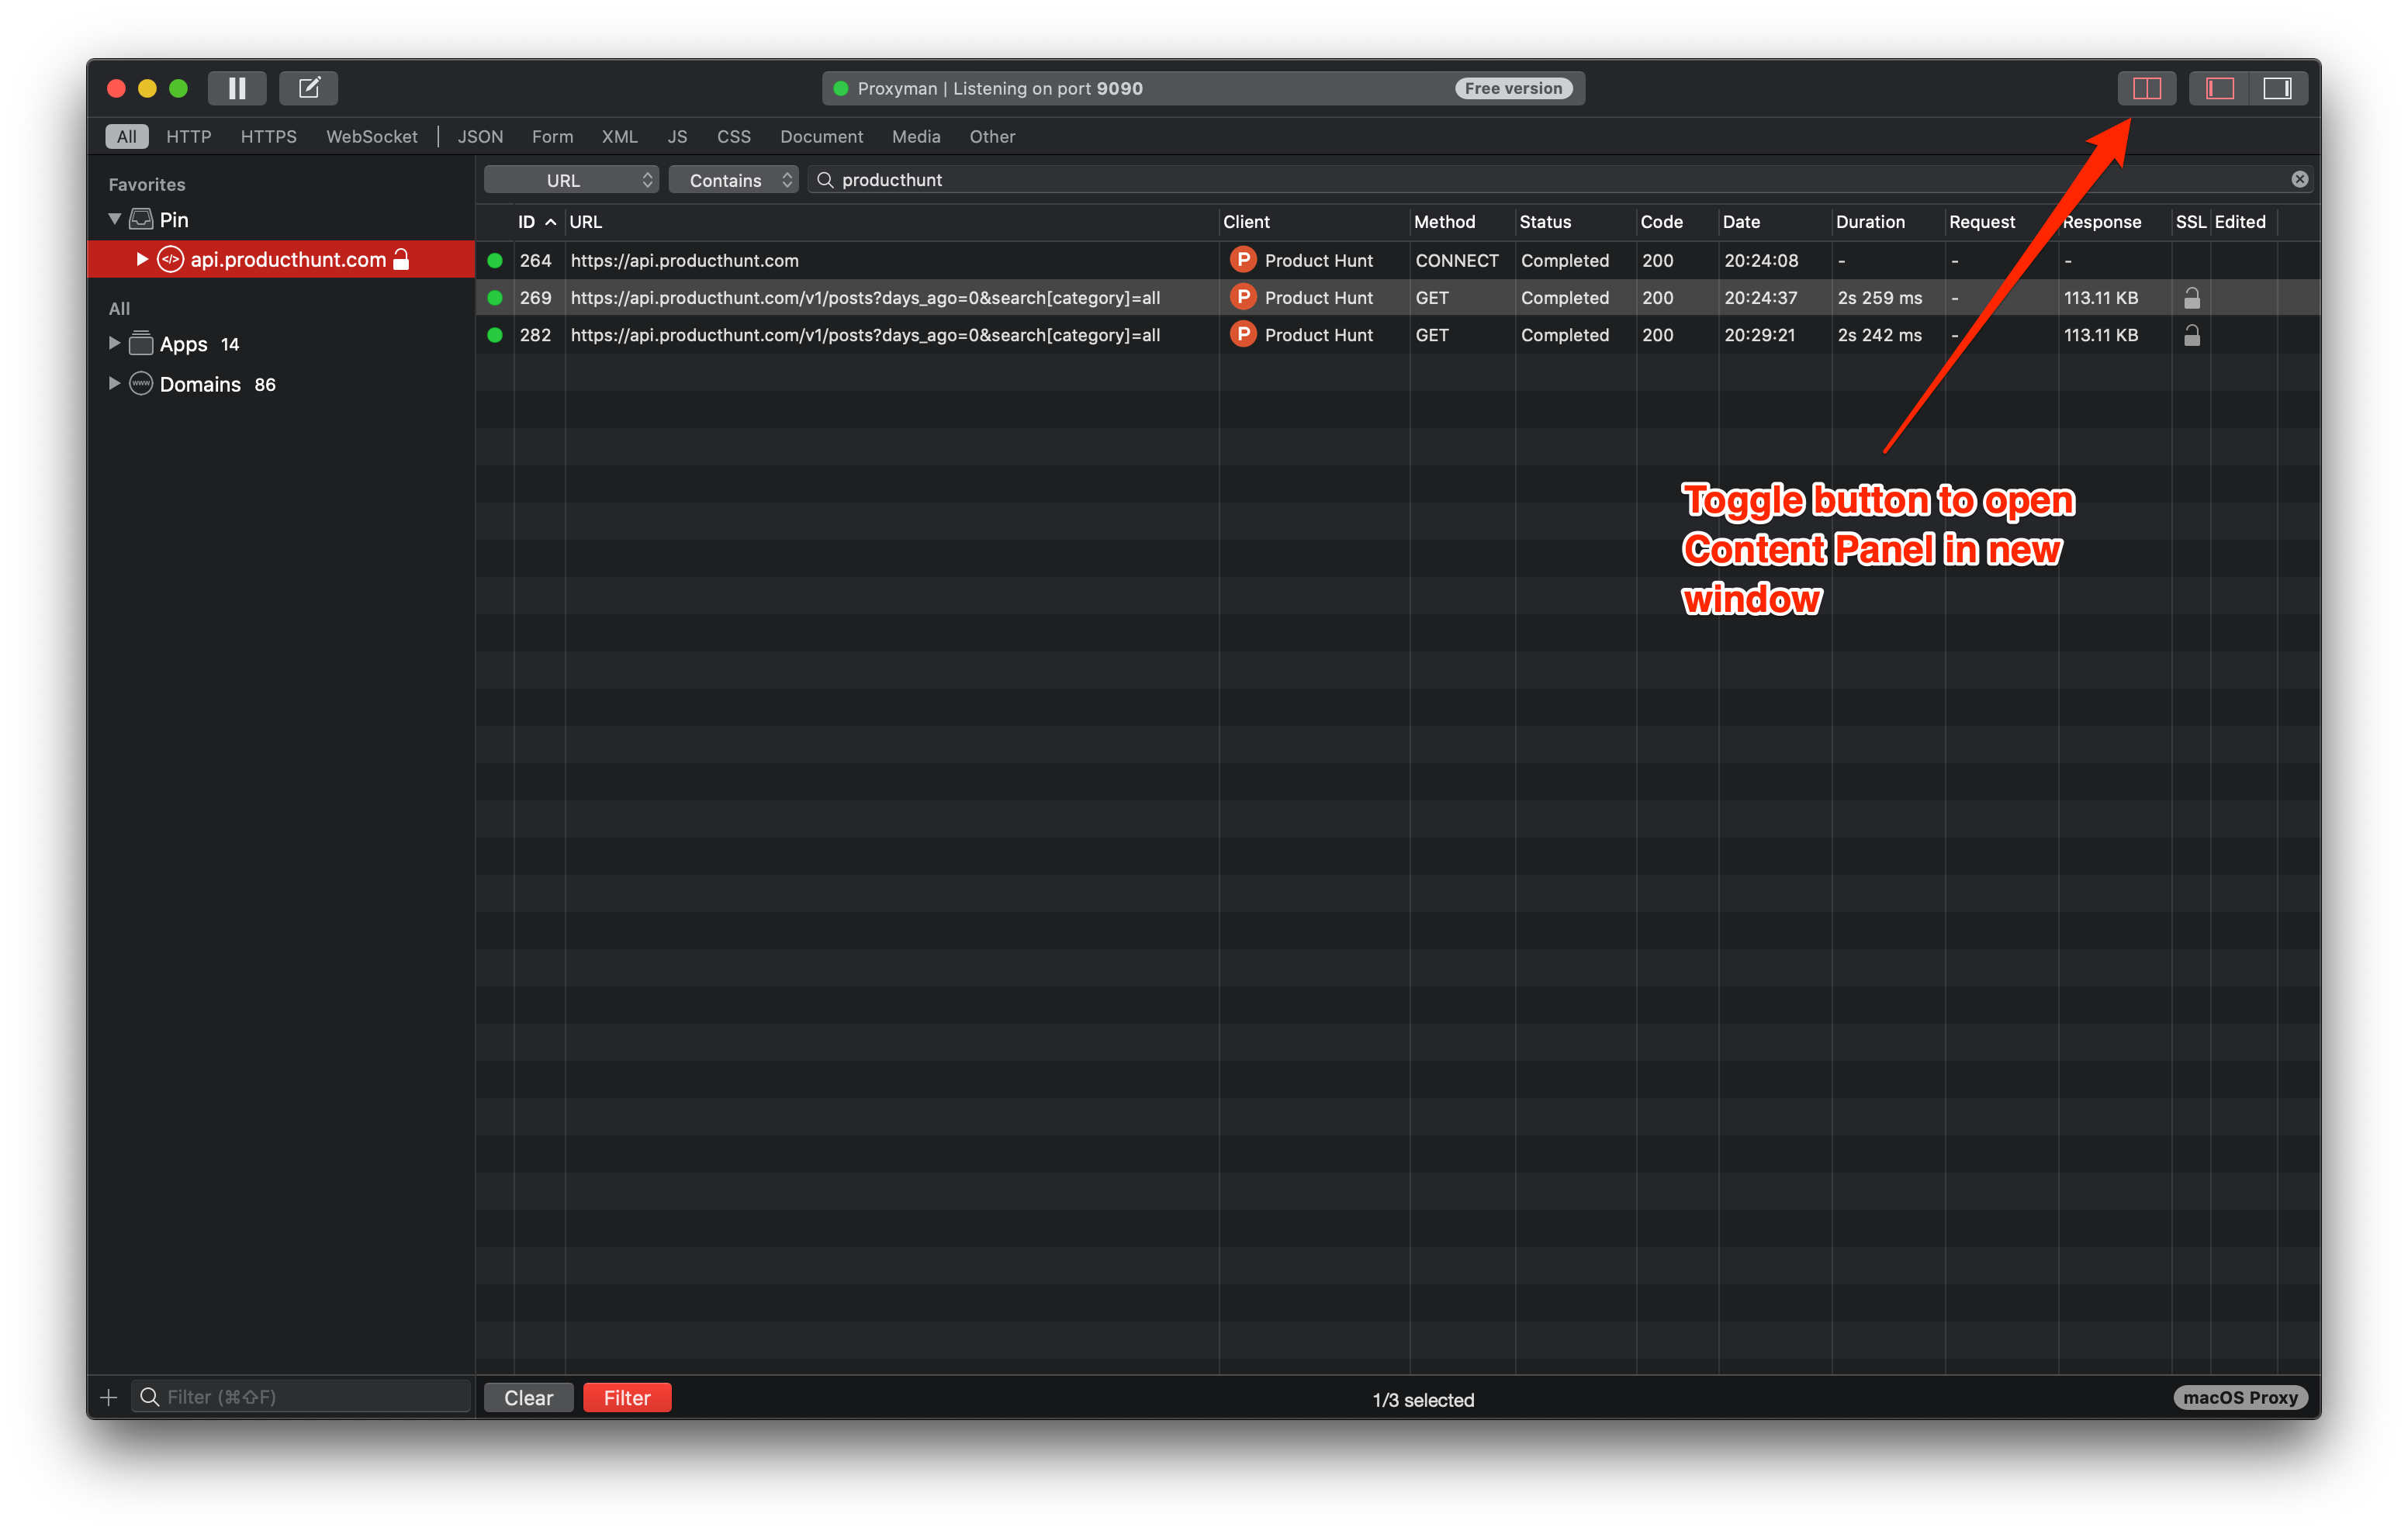
To fully focus on the content of requests/ responses, developers can also open the Content Panel in new window by toggling the Custom Layout button.
With that new window, it might be easier for developers to maximize the workspace and work with the content without any distraction. This new window should also update new content each time you select another URL.
4. Edit requests/responses
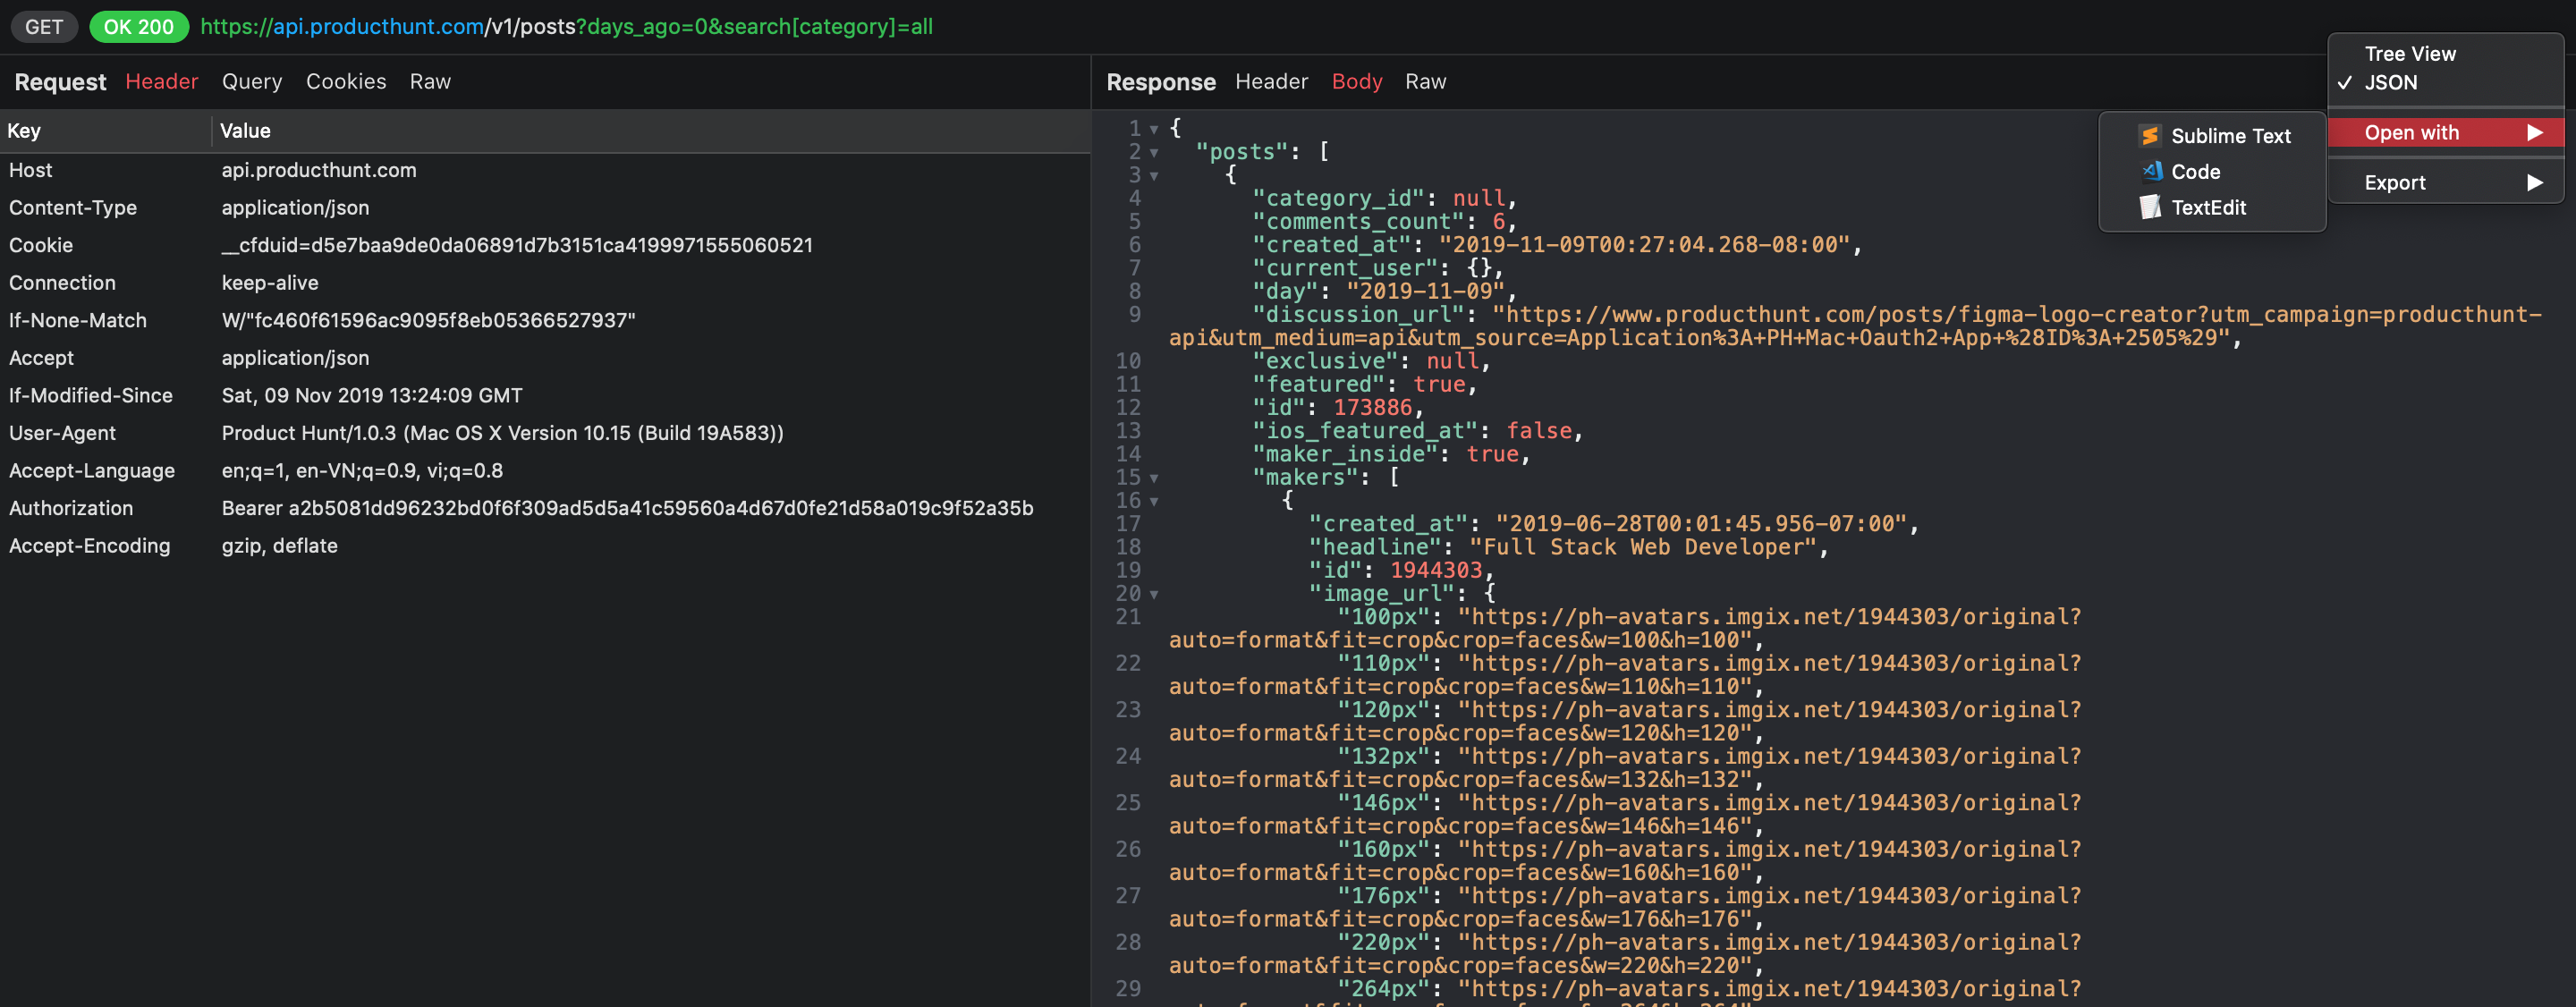
The final helpful tip is to use drop-down button to switch between Tree View or JSON format.
Proxyman also auto-detect your Editor tools so that you can quickly open such your favorite tool like Sublime to edit current responses.
What’s next?
With all of these tips, we hope that it could make our developers’ lives a little bit easier. There would be more useful features coming so stay tuned.
Happy debugging :)
Proxyman is a high-performance macOS app, which enables developers to capture and inspect HTTP/HTTPS requests from apps and domains on iOS device, iOS Simulator and Android devices.
Get it at https://proxyman.io

